
Making accurate audio measurements in cars is complex and ever-changing as manufacturers incorporate functionality such as spatial audio, sound zones, vibration exciters, and more. Automotive companies, infotainment system subcontractors, consultants, and speaker manufacturers range from extensively testing every aspect of the system to measuring nothing at all.
In 2023, the Audio Engineering Society (AES) Technical Committee on Automotive Audio published a white paper [1] proposing a standardized measurement configuration to facilitate repeatable and comparable measurements. It covered three basic measurements: frequency response, Max SPL, and impulsive distortion. This is a strong start toward industry standardization, but as a first publication, it is narrow in scope, focusing on three important measurements. However, the test configuration detailed in the white paper also lends itself well to a much wider range of in-car measurements.
In this article, we use the same test configuration to make a more comprehensive suite of in-car audio measurements and explain how these provide valuable insight into the performance of infotainment systems. These include seat-to-seat spectral uniformity, THD, intermodulation distortion (IMD), Max SPL at 10% distortion, and more advanced impulsive distortion as well as the basic measurements.
Test Configuration
All measurements described here are made using the TC-AA recommended test configuration in a modern electric vehicle in a quiet underground parking garage. Before beginning, all user-accessible audio settings (e.g., tone controls, faders, etc.) including EQ and spatial settings are set to default.
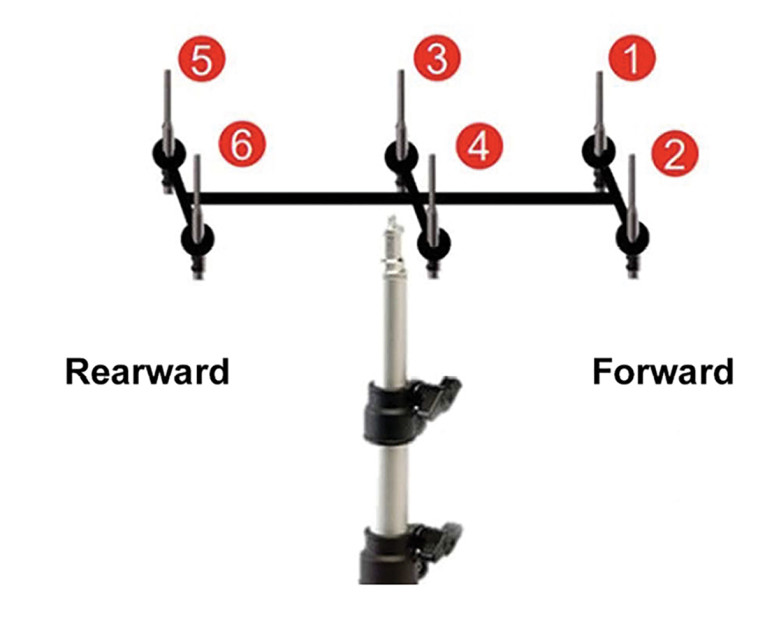
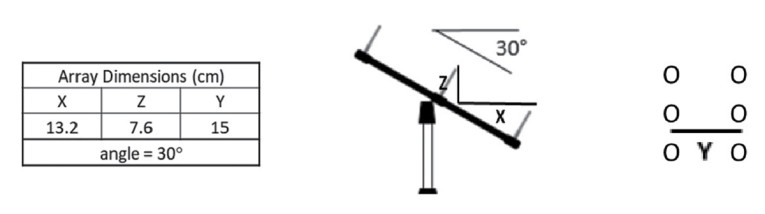
Figure 1 shows the test configuration. The response signal is captured by a microphone array containing six SCM measurement microphones. The microphone array is positioned in line with the white paper guidelines. It is set to a height of 74cm with a 30° angle, centered in the driver’s seat with the microphone stand legs positioned against the back of the driver’s seat. The distance between the closest microphone and the headrest is 10cm and the brake pedal to backrest distance is 100cm.
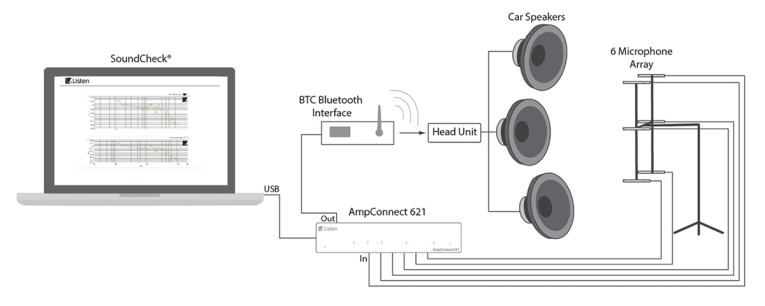
Listen’s SoundCheck software is a full-featured and flexible audio test system capable of making all the measurements outlined in the white paper. Of specific note is its ability to power average the inputs from the six microphones in ISO standard 1/3 octave bands that is required for most of the measurements. In addition to generating the required test stimuli for the TC-AA proposed measurements, it can also play a much wider range of signals to permit IMD measurements, perceptual measurements, and even tests with music or speech.
The test signal is input to the car’s head unit via a BQC-4149 Bluetooth interface. This is a small, portable Bluetooth interface specifically designed for audio measurement. It uses an A2DP codec for the best frequency response and SNR. The Bluetooth interface integrates seamlessly with SoundCheck, wirelessly transmitting the test stimulus to the car’s head unit for playback through the speakers.
Before making any measurements, the test system inputs and outputs are calibrated by measuring the sensitivity of each individual microphone in the array with a Brüel & Kjær 4231 acoustical calibrator and storing these readings in the software calibration menu.
Acoustical calibration is preferred over reading the transducer electronic datasheet (TEDS) data as it accounts for actual measurement conditions including temperature and cabling losses. The audio interface is also calibrated to ensure proper response frequencies and levels, both in the analog and digital domains.
System Characterization Measurements
Frequency Response
Frequency response is the clearest indicator of overall performance. If it is outside the limits, the tonal balance is affected, and the audio system may not sound as intended.
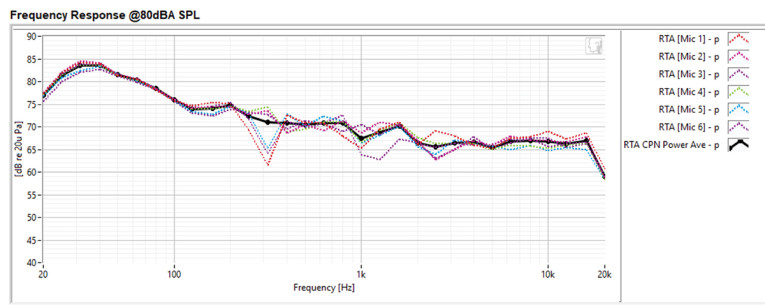
Frequency response is evaluated using correlated pink noise in line with the white paper recommendations. It is measured at 80dBA using monophonic, correlated pink noise on both left and right input channels on the head unit. This test level was chosen as it is a typical listening level and below the threshold at which the head unit would typically apply loudness compensation.
First, the system is calibrated to ensure the volume control is correctly set for a power average of 80dBA across all six microphones. The test stimulus plays for 30 seconds, and the response is captured by the six microphones. The test system measures and compensates for any delay between the output test signal and the acoustic input signals to the microphones. Such delays can be significant, so delay compensation is critical to making accurate measurements.
The graph in Figure 2 shows a 1/3 octave analysis for each microphone 1 through 6. The difference in the response of the individual microphones due to location, reflections, and standing waves in the car is obvious, especially from 200Hz to 400Hz. The black curve is the overall power average, or spatial average, of all six microphones as specified in the AES white paper. The spatial-averaged response is fairly smooth, which correlates to how a human would perceive the sound in the car; this contrasts with the bumpy response for the individual microphones, particularly above 200Hz.
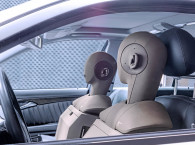
The microphone closest to a particular loudspeaker, for example, the speaker in the door, typically has a higher level than the other microphones at some frequencies and lower at others. It should be noted that this measurement configuration is not recommended where speakers are in the headrest due to their proximity to the microphone array. The TC-AA is currently evaluating approaches for more complex systems such as those with headrest-mounted speakers.
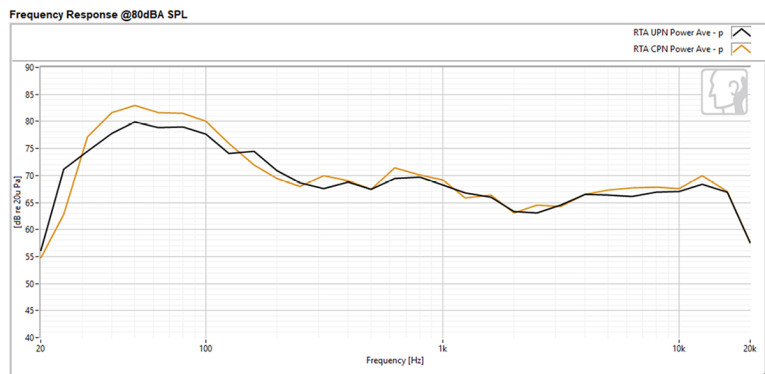
The test method is identical to the frequency response with correlated pink noise except that the noise is uncorrelated (i.e., randomized between the left and right channels rather than playing the same pink noise out of the left and right channels).
Figure 3 shows the power averaged frequency response curve for uncorrelated pink noise (black line) and correlated pink noise (orange line). These results show that uncorrelated pink noise has less output than the correlated pink noise, about 6dB above 1kHz and 8dB to 11dB below 1kHz. It is surprisingly uniform and indicates a well-matched system.
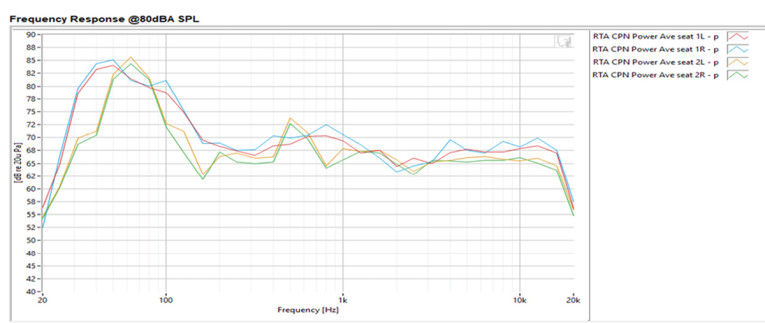
Ideally, each passenger in the car experiences the same high-quality sound performance from the infotainment system. However, it is extremely difficult to independently equalize the loudspeaker playback system for each seat in the car. Trade-offs are made in the infotainment system tuning, typically favoring the driver’s seat. This results in the frequency response in the other seats being less smooth or ideal.
Figure 4 shows the results when the frequency response with correlated pink noise is repeated in each of the car’s four seats. It reveals that the bass performance in the rear passenger seats (orange and green lines) is not as extended or smooth as the front passenger seats.
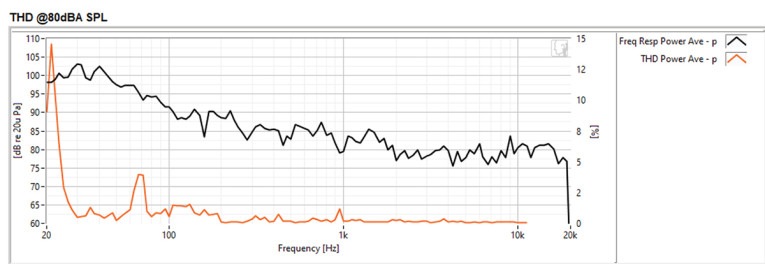
Although not included in the TC-AA’s initial recommendation, THD is a valuable measurement. It indicates the overall nonlinear performance of the device, and a measurement outside the limits may indicate a poorly centered voice coil, or mechanical defects. The THD is measured at 80dBA, using a stepped sine sweep stimulus from high to low with 12th-octave steps. There is some averaging at each frequency step to minimize background noise but not long enough for the system’s compressors to activate. Sweeping from high to low achieves more consistent results as it delays compressor activation and minimizes ringing compared to sweeping in the opposite direction.
As before, the spatial average of all six microphones was power summed to smooth out the standing waves and reflections picked up by the individual microphones and produce the THD power average curve shown in Figure 6. In this case, the THD is relatively low — roughly 2.2% from 50Hz to 10kHz.
IMD is a good test for multi-way speaker systems with a crossover. Intermodulation distortion can be observed when a small driver is trying to play back low and high frequencies simultaneously. Measurements are made using a two-tone stimulus with a fixed tone set to 50Hz and a sweeping tone from 20kHz to 150Hz.
First, the test sequence sweeps from 20kHz to 200Hz to set the auto-delay and auto-range the input gain for the best SNR. Since distortion harmonics can be up to 60dB below the fundamental and still be audible, it’s important to ensure that they are above the noise floor of the measurement. Next, the IMD stimulus is played, and the responses are power-averaged and displayed.
Figure 7 shows the fundamental and total IMD of the second and third order intermodulation products, power averaged from the six-microphone array.
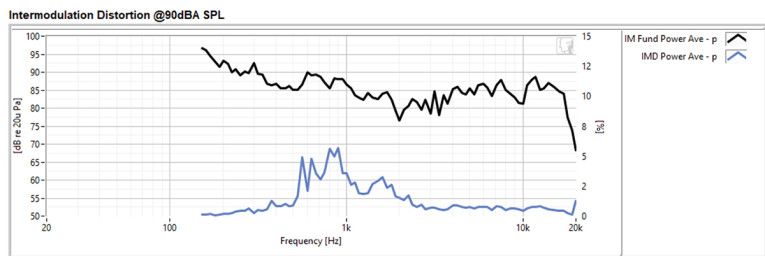
As expected, the IMD is higher at the lower frequencies but there is also an increase around 1.5kHz, which is probably a crossover frequency in this car. Taking the power average of all six microphones results in an overall average level of 2% IMD.
Maximum SPL
Max SPL makes it easy to compare the maximum volume of an infotainment system in a car. It is defined as the maximum sound pressure level that a car’s infotainment system can reproduce inside the cabin with its windows, sunroof, and convertible top closed. This measurement combines all the components of the system — speakers, amplifiers, power supply, and more.
There are many ways to measure Max SPL, but to keep it simple, the TC-AA committee recommends two different measurements: overall Max SPL, and Max SPL spectrum regardless of distortion level. The TC-AA suggests that distortion is not taken into account when measuring the Max SPL spectrum because the system’s onboard signal processing (e.g., compressors, limiters, etc.) makes it challenging to characterize.
Our first measurement is made exactly according to the TC-AA recommendations. The volume control of the infotainment head unit is set to maximum. Overall, Max SPL and SPL spectrum are measured simultaneously, using a 30-second broadband 20Hz to 20kHz, -12dBFS monophonic pink noise stimulus with a crest factor of 12dB. The results are shown in Figure 8.
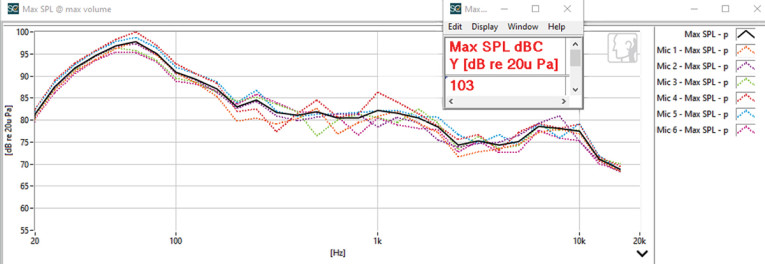
The overall level of 103dBC, regardless of distortion, is not too loud but may be limited by design to prevent severe distortion at low frequencies from clipping the amplifier.
Max SPL at a Fixed Percentage Distortion
Although the TC-AA proposal recommends measuring Max SPL regardless of distortion for simplicity and because it is easy to make on many commercial measurement systems, there is a strong argument for defining the Max SPL based on the onset of audible distortion. After all, the loudest useful volume for a car audio system is one at which it still sounds good.
Since compressors and limiters have a time constant to allow for short-term transient peaks typically found in music, it is possible to measure the Maximum SPL and distortion using a short tone burst before they take effect. This method, however, is significantly more complex than simple Max SPL and requires a test system that permits a high degree of customization and automation to implement effectively.
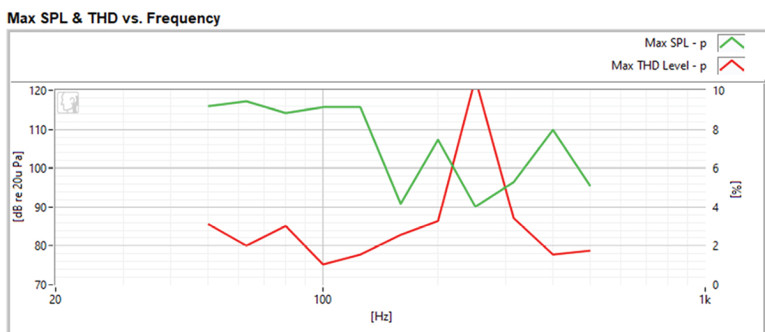
For this measurement, we used a 50-cycle tone burst. This ranges from 500ms duration at 100Hz to 50ms at 1kHz and is short enough to avoid damaging the speaker. The test sequence measures and records the Max SPL at the onset of a specified percentage distortion at a discrete set of frequencies. These readings are combined to produce a graph of Max SPL versus frequency.
For each measured frequency, the test sequence plays the stimulus multiple times, increasing the level in 3dB steps until the THD exceeds 10%. The level is then reduced by 3dB and increased in smaller increments of 0.5dB to more precisely find the 10% THD threshold. The Max SPL is recorded at that frequency and the test sequence continues to the next 1/3 octave frequency. Although this measurement takes approximately twenty minutes to run, the entire process is completely automated via the test sequence to minimize human interaction.
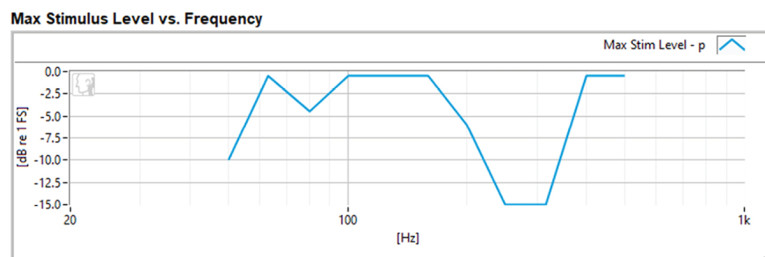
Figure 9 shows the Max SPL and corresponding THD. When the THD reaches 10% or the Maximum Stimulus Level with the head units’ volume control set to max, as shown in Figure 10, the SPL is plotted. At some frequencies, particularly higher frequencies, for example, 400Hz and 500Hz, the maximum input level is reached before the system distortion reaches 10% THD. The stimulus level is typically limited by the lower frequencies where there is more distortion. Since it is debatable how audible THD is, it is possible to use other criteria such as Rub & Buzz distortion to find the Max SPL limit.
Vehicle Integrity Measurements
Impulsive Distortion
Infotainment system sound quality is sometimes limited by vehicle integrity. If speakers cause door panels, loose wire harnesses, fasteners, and more to vibrate, audible buzz, squeak, and rattle degrades the listener’s experience. Before performing system characterization measurements, it is a good idea to ensure the infotainment system is correctly installed in the vehicle under test. This can be achieved by measuring impulsive distortion. This test may also be used as an end-of-line check to verify vehicle integrity.
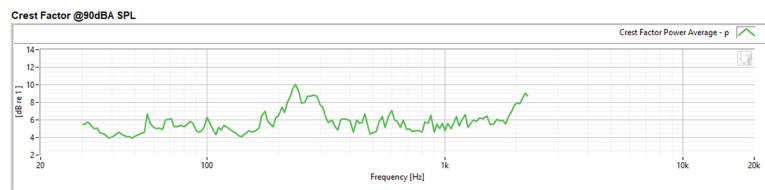
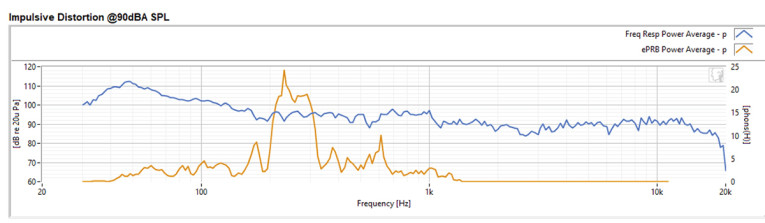
The AES white paper recommends evaluating impulsive distortion using a crest factor measurement with a logarithmic sine sweep and a tracking high-pass filter, 10 times greater than the stimulus frequency, at 80dBA and 90dBA. The crest factor is the ratio of peak level to RMS level. A sine wave has a crest factor of 3dB. Pink noise has a crest factor of about 12dB. Transients (e.g., rattling wires, loose fasteners, and background noise), have a crest factor typically greater than 8dB. A crest factor greater than 3dB, may indicate buzz, squeak, and rattle. However, background noise, especially in a noisy factory, may cause similar crest factor results, so background noise should be minimized, and the operator must ensure that the results correlate with audible experience. Since there was no audible or measurable buzz, squeak, and rattle at 80dBA in this car, it was re-measured at 90dBA where the distortion became audible. This distortion is visible in the crest factor measurement (Figure 11), especially between 200Hz to 300Hz.
The Perceptual Rub & Buzz results in Figure 12 show a noticeable bump around 200Hz to 300Hz and a smaller, sharper bump at 600Hz, which is not visible in the crest factor measurement. These are clearly audible during the sweep.
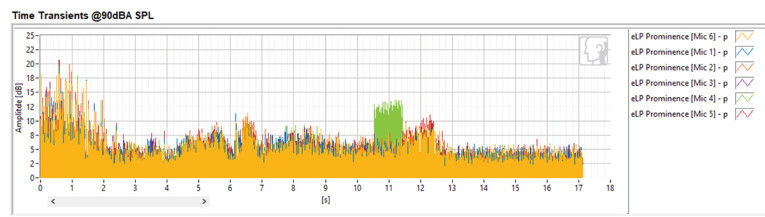
The transient distortion versus time measurement reveals any loose particles or rattling wires in the car with greater precision than frequency response since it tracks individual events. Crest factor, which is a running average, will smooth out some of the transients by the very nature of its calculation.
Figure 13 shows the time transients of the impulsive distortion measurement. Analyzing impulsive distortion in the time domain displays the constant background noise as a steady noise floor and impulsive distortion is highlighted as well-defined transient spikes. In Figure 13, transient spikes from measurement microphones #4 and #5 are observed around 11 to 12 seconds into the sweep. These are closer to the driver-side door where a door panel is rattling at frequencies around 200Hz to 300Hz in the sine sweep.
Conclusions and Future Work
The calibrated measurements of frequency response, distortion, and Max SPL outlined in the TC-AA white paper provide a good foundation for objectively analyzing infotainment system performance and ensuring consistent measurements, making it easier to compare the performance of different vehicle audio systems.
The equipment configuration also lends itself well to a much wider range of audio measurements to objectively analyze infotainment system performance, such as those demonstrated here. This enables car manufacturers to use the same equipment to make both standardized measurements and expand the suite of tests to meet their own specific R&D and production line needs.
However, vehicle infotainment systems are increasing in complexity. An ever-increasing number of speakers are being installed in the car at various locations including the headrest and ceiling. Vibration exciters are being added to the seats of some cars to extend bass response. Signal processing is ever-increasing as manufacturers add Dolby Atmos, spatial audio, and even sound zones to their vehicles. As a result, more sophisticated acoustic, vibration, electrical, and psychoacoustic measurements are needed to correlate measurements to human perception of sound inside a vehicle. While many of these measurements can be made today, test systems must continue to evolve to keep up with the needs of this rapidly changing market.
The continued development of standards is vital to ensure repeatable and comparable measurements. The TC-AA committee is currently refining its measurement methods based on industry input received since the publication of this paper and expects to publish an update in the coming year. Car manufacturers are encouraged to continue making measurements using these methods and provide feedback. It is hoped that this work will eventually lead to an industry standard. aX
References
[1] Audio Engineering Society (AES) Technical Committee on Automotive Audio In-Car Acoustic Measurements, white paper, October 2023.
[2] IEC 61672: Electroacoustics – Sound level meters, the International Electrotechnical Commission.
[3] ANSI S1.11 - 2004 class 0 & IEC 61260-1:2014 reference standard for nth octave filters, the American National Standards Institute.
TC-AA Test Configuration
There are three parts to the test configuration: the microphones, their positioning, and the analysis equipment.
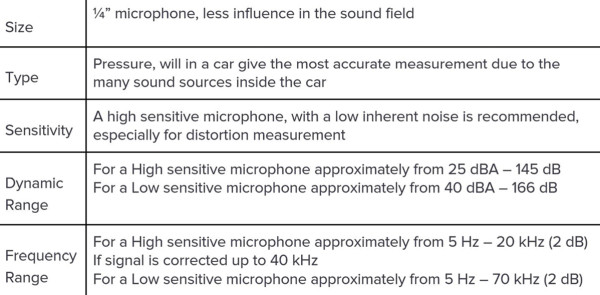
The playback method is not specified, permitting the use of a USB memory stick, Bluetooth, or proprietary methods. Note that when using Bluetooth, only a high-quality calibrated interface designed for audio testing should be used, as precise control of the codec selection and test level is required.
This article was originally published in audioXpress, June 2025